


The U.S. coal ash market remains in a dynamic state since the Environmental Protection Agency’s (EPA’s) 2015 issuance of “final” disposal rules regarding coal combustion residuals (CCRs). Owners and operators of units covered by the CCR rule are now grappling with closure options and compliance deadlines even as EPA considers further regulatory changes.
In the larger picture, U.S. coal consumption has dropped to its lowest levels since the late 1970s amid the closure of 546 coal-fueled generating units between 2010 and the first quarter of 2019. The latest figures from the Energy Information Administration (EIA) show a continuance of that trend through 2025, albeit at a slower pace.
With this as background, we look at three dimensions of the U.S. coal ash materials market. First, we focus on the compliance impact of the CCR regulation on owner/operators. Next, we look at existing coal ash inventories and market trends. Finally, we expand our discussion to CCR demand in relation to its sources. Our perspective is informed by the inventory of materials currently in place within coal ash handling units at power plants, as well as on how regulatory drivers impact the ways in which those materials may become available.
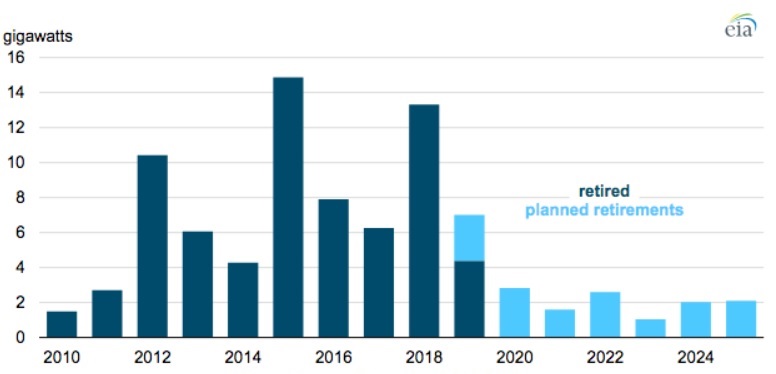
Figure 1. Total net summer capacity of retired and retiring coal units (2010-2025). Source: EIA
Coal Ash Materials and the Regulatory Environment
Making educated predictions about the future of the U.S. coal ash market involves understanding the regulatory impacts of EPA’s 2015 CCR rule. Here we’ll provide a summary to set the stage. The regulatory challenge for operators/owners is twofold with respect to the CCR rule: the management of coal ash due to landfill closures and environmental obligations on compliance.
Currently, owner/operators coming into conflict with the CCR rule face at least two primary challenges to keeping CCR units (existing landfills and surface impoundments) open:
- Location restrictions
- Groundwater protection standard exceedance
Concerning location restrictions, five criteria drive the compliance program with specific timeframes. CCR units cannot be:
- Located within five feet of the uppermost aquifer
- Situated within a wetland
- Located in fault areas
- Situated within an active seismic zone
- Located within unstable areas
Referring to these criteria by number, restrictions #2 through #5 required CCR unit closure by April 17, 2019. Restriction #1 has an action date of October 31, 2020, to cease operations and initiate shutdown.
Notably, there is pending regulation, and White House Office of Management and Budget review, that would extend the October 2020 deadline. Looking across the total CCR units facing closure at that time due to the location restriction relative to aquifer separation, the top five states are identified in Figure 2.
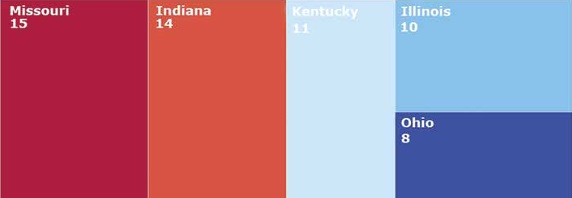
Figure 2. Location restricting pending closure.
All told, we estimate that units requiring closure due to their proximity to the uppermost aquifer represent more than 200 million cubic yards of material. Note that these figures are based on “at-risk” CCR units, not those that are already closing.
Next, we look at annual groundwater monitoring requirements and groundwater protection standards (GWPS). Each year, §257.90 requires that owner/operators monitoring CCR units for groundwater problems issue a report on their groundwater monitoring and corrective actions taken. Determining whether there is a problem at a site is an involved process. If any statistically significant levels of contaminants are identified, and where GWPS exceed regulated analyte, the EPA will require action. Fifteen analytes are monitored, and lithium, cobalt, and arsenic are the most common elements with excessive measurements.
As shown in Figure 3, most sites had exceedances with two or three analytes. One location reported exceedances on nine analytes.
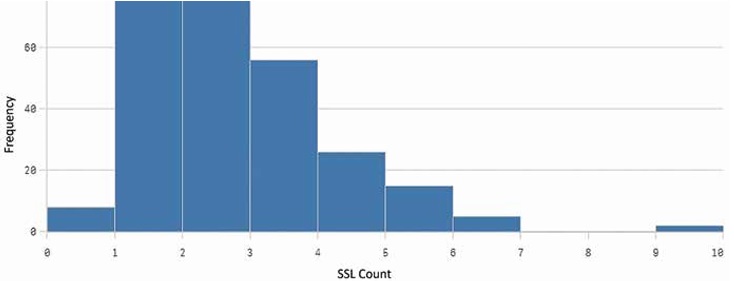
Figure 3. GWPS histogram
The analysis is based on onsite groundwater monitoring wells, meaning that there is not necessarily any off-site groundwater migration. Nevertheless, if a CCR unit is linked to an increase in monitored well levels of any of the 15 analytes, it may be required to close by
October 31, 2020.
The following partial heat map of the eastern U.S., in which the intensity of the shading corresponds to the number of GWPS exceeded at nearby sites (see Figure 4).
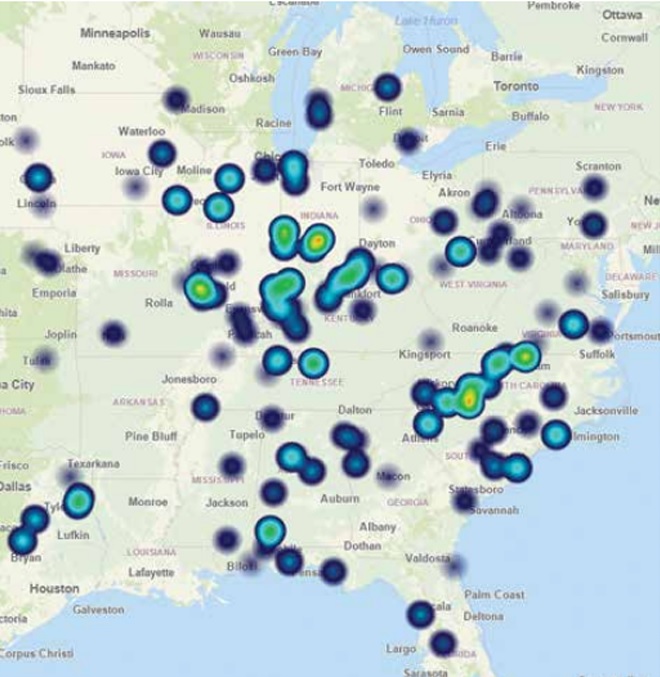
Figure 4. Heat map showing the relative number of GWPS exceeded at nearby sites.
Some further explanation on this point: if there is only one GWPS exceeded, there will be a small, lightly shaded circle at the plant location. If there are multiple analytes, there is a yellow-to-red color.
With everything included, we estimate that units requiring closure due to GWPS exceedances represent more than 1 billion cubic yards of material.
The amounts between location restrictions and GWPS are not additive since some CCR units are facing double jeopardy. Both are drivers that contribute to the risk of closure. Once closure is initiated and public notification occurs, the closure project is on a timeline that is based on factors such as state regulatory approval, whether the CCR unit will be closed in place or closed by removal, ongoing power plant operations, and the size and complexity of the closure project.
Estimating the Coal Ash Inventory
How much ash is already out there? U.S. coal-fueled electricity generation has declined from its peak of a decade ago and, in April 2019, was surpassed by generation from renewables for the first time ever. While this decreasing trend is bad news for the total coal inventory in the long term, CCR usage reached 71.8 million tons in 2017, which was a record high.
Now, let’s get into the details on the estimation of the number and total volume of CCR-regulated and legacy coal ash landfills and surface impoundments. With respect to the CCR-regulated U.S. market, the available figures include:
- 111 owners and operators
- Approximately 300 sites
- Over 700 CCR units
Figure 5 shows the CCR material volume for the top five U.S. states. Pennsylvania is first with more than 250 million cubic yards of material, followed by Kentucky and West Virginia. We maintain comprehensive datasets in this regard nationwide.
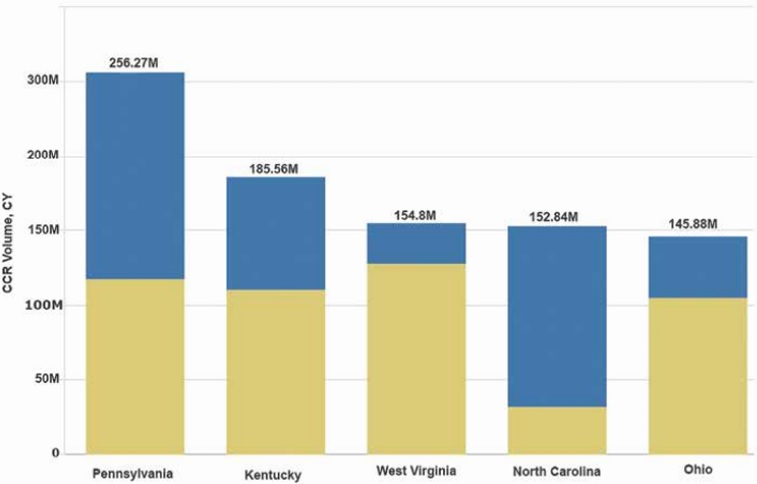
Figure 5. CCR material volume by top five states, CY
Regarding legacy materials, there is an opportunity for some serious detective work to estimate the amount of material produced, disposed of onsite or off-site, and not previously beneficiated.
The oldest power plants still in use in the U.S. are more than 70 years old. According to EIA, more than 88% of coal-fueled capacity, as of December 2016, was built between 1950 and 1990. It stands to reason that these legacy plants, some of which no longer exist, had coal ash accumulations. The EIA data repository also includes some coal boiler retirements going back to the 1960s and 1970s. The changes to the coal industry were happening before the CCR rule—and if you go back far enough, there was no regulation on how coal ash materials were handled.
Knowing the extent of legacy ash repositories could maximize the potential beneficial use. In addition to the materials buried or otherwise stored at plant sites, materials in waste monofills could be harvested and used. ASH at Work (Issue 1, 2019, p 23) refers to the Washingtonville monofill, where approximately 2 million tons of high-grade fly ash is available for harvesting and beneficial use. The fly ash originated from power plants in the 1980s and 1990s.
At this time, owners of a legacy impoundment are not obliged to comply with the federal CCR regulations.
Coal Ash Demand in Relation to the Sources
Using fly ash and bottom ash as replacement materials in cement and concrete applications represents high-value alternatives to disposal that help reduce raw material extraction from quarries and generate lower manufacturing-related greenhouse gas emissions. The location of ash vis-à-vis the manufacturers that would beneficially use it is key to unlocking new opportunities for sustainable coal ash usage.
The U.S. Department of Transportation maintains approved source and location supplier lists. The supply source and location are supported by the respective state DOTs to supply coal ash, in particular, fly ash, to Department projects. FirmoGraphs has recently started tracking and updating approved coal ash suppliers and source plants at the request of the SEFA Group, which provided the source information.
On a large scale, organizations are looking into the proximity of coal ash sources to customers and the accessibility of those locations by road, barge, and rail. These factors are a crucial determinant of transportation costs, freight charges, labor, and wages. Significantly, full excavation is regarded as the most expensive option, often counterbalanced by the permanent removal of a liability. Such factors drive the economics for strategic hinking and offer the potential to offset the costs associated with CCR challenges.
Conclusion
In a market such as that for U.S. coal ash, it is critical to be aware of the inherent risks and upcoming trends. On an ongoing basis, there are regulatory developments, both federal and state, site environmental obligations, decisions around site operations and CCR unit mitigation, changes to coal ash inventory, and beneficial use opportunities. FirmoGraphs tracks and updates these changes daily, creating a structured and reliable data set that is presented in modern and flexible business intelligence software, Qlik Sense Enterprise™.
Rather than handling all of these challenges themselves, involved organizations such as AECOM, Suez, and the SEFA Group have joined forces with FirmoGraphs in using the Ash Mart™. Data subscriptions are available to use within our provided software or in your system.
Note: Reprinted with permission from the American Coal Ash Association